Using F3 to Monitor FPS and Performance (Step by Step)
Monitoring performance in Minecraft: Java Edition is crucial for a smooth and enjoyable gameplay experience. The built-in F3 debug screen offers a powerful suite of tools to help players understand what’s happening under the hood of their game client. By leveraging this often-overlooked feature, you can diagnose performance issues, identify bottlenecks, and gain valuable insights into your Minecraft world.
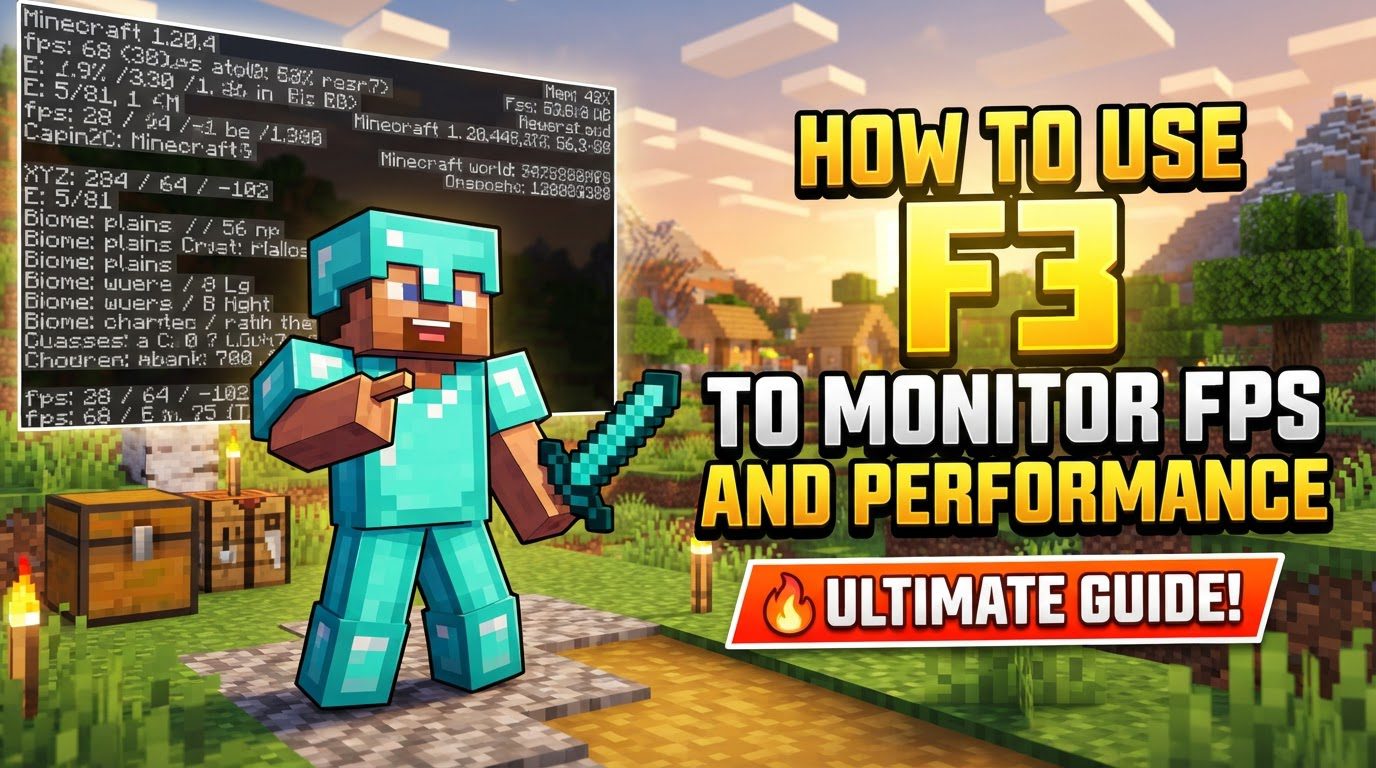
Understanding the F3 Debug Screen
The F3 debug screen is an intricate overlay designed for Minecraft: Java Edition, presenting a wealth of real-time technical information directly within your game window. This comprehensive display is invaluable for anyone looking to delve deeper into the game’s mechanics and performance metrics.
When activated, the F3 screen provides a broad spectrum of data, including your current Frames Per Second (FPS), precise coordinates (X, Y, Z) within the game world, the biome you are currently situated in, local light levels, and detailed information about memory and CPU usage. It serves as a central hub for various diagnostic details.
- Left Side Information: The left side of the debug screen is typically dedicated to game-specific information. This includes the current Minecraft game version you are playing, your real-time FPS, your chosen graphics settings, and various data related to chunks, which are the fundamental building blocks of the Minecraft world. This chunk-related data can give you an idea of how many chunks are loaded and rendered around you.
- Right Side Information: The right side of the screen focuses more on your system’s interaction with the game. Here, you’ll find details about the Java version running Minecraft, current memory allocation and usage, CPU information, and specifics regarding your GPU and OpenGL implementation. These metrics are vital for understanding how your hardware is coping with the game’s demands.
- Additional Debug Actions: Beyond just displaying static information, Minecraft’s F3 screen is also a gateway to various dynamic debug actions. These actions are triggered by combining the F3 key with other keys, allowing you to perform tasks such as reloading chunks, toggling the visibility of entity hitboxes, or showing chunk borders, each serving a specific diagnostic or gameplay purpose.
Step-by-Step Guide to Using F3
Accessing and utilizing the F3 debug screen is a straightforward process, though it may require a slight adjustment depending on your keyboard and operating system.
- Open the Debug Screen: The primary action to open this invaluable overlay is to simply press the
F3key on your keyboard. Upon pressing it, the detailed debug information will appear, typically in the top-left and top-right corners of your screen. - Laptop/Mac Users: For users playing on a laptop or a Mac, the process might differ slightly. Many modern laptops assign multimedia functions to the F-keys by default. In such cases, you will likely need to press the
Fn(function) key simultaneously withF3(e.g.,Fn + F3). Mac users might find thatOption+Command+F3is the correct key combination to activate the debug screen. This ensures that the F3 key’s intended function for Minecraft is executed rather than a system-level command. - Identify FPS: Once the debug screen is active, your current Frames Per Second (FPS) will be prominently displayed. This crucial metric is typically located in the top-left corner of the debug screen, providing an immediate indicator of your game’s performance. A higher FPS generally signifies a smoother gameplay experience.
- Customize Display (Minecraft 1.21.9+): In more recent versions of Minecraft, specifically 1.21.9 and later, the F3 screen offers enhanced customization options. If you wish to tailor the information displayed or ensure specific data like FPS is always visible, you can hold down
F3and then pressF6(or in some instances,F5). This action grants you access to debug options, allowing you to select and manage which specific data points, such as FPS, are shown on the overlay or are permanently displayed. - Additional Debug Options: To gain a comprehensive understanding of all available F3 key combinations and their respective functions, you can hold down
F3and then press theQkey. This action will bring up a list of all F3-related shortcuts directly on your screen, serving as a quick reference guide for various debug actions.
Important Tips for Performance Monitoring
Beyond simply opening the F3 screen, understanding how to interpret and utilize the various key combinations and data points is essential for effective performance monitoring and troubleshooting.
- Monitor FPS: The Frames Per Second (FPS) counter is your primary tool for gauging the overall smoothness of your game. By consistently monitoring your FPS, you can quickly identify periods of performance degradation or “lag.” A fluctuating or consistently low FPS can indicate that your system is struggling to render the game, thereby helping you pinpoint potential performance bottlenecks. Understanding your typical FPS range allows you to detect when something is negatively impacting your game’s fluidity.
- Identify Performance Hogs: The F3 screen provides valuable insights into your system’s resource utilization, specifically CPU and memory usage. By paying close attention to these metrics, you can gain an understanding of whether your system resources are being strained. For instance, consistently high CPU usage or rapidly depleting memory allocation might suggest that certain game elements or background processes are consuming excessive resources, thus acting as “performance hogs” that slow down your game.
- Reload Chunks: A useful shortcut for resolving visual anomalies or updating the game world’s rendering is
F3 + A. This combination reloads all chunks immediately surrounding your player. It can be particularly helpful if you encounter visual glitches, chunks that haven’t loaded correctly, or if you’ve made changes that require the world’s rendering to be refreshed. - Toggle Hitboxes: For players involved in combat, precise building, or detailed interactions, the ability to toggle entity hitboxes is invaluable. Pressing
F3 + Bwill display the bounding boxes of all entities around you. This visual aid is incredibly useful for understanding the exact dimensions and collision boundaries of creatures, players, and other interactive elements, aiding in more accurate aiming and placement. - Check Tool Durability: When working with tools, weapons, or armor, knowing their exact durability and other hidden attributes can be beneficial. Using
F3 + Hactivates advanced tooltips. With this feature enabled, hovering over an item in your inventory will display additional information, such as its item ID and its current durability, offering a clearer picture of its remaining lifespan. - Reload Resources: Resource packs are a popular way to customize Minecraft’s appearance and sounds. When developing or testing resource packs, or if you suspect an issue with loaded assets,
F3 + Tis an essential shortcut. This command reloads all textures, models, and sounds, ensuring that any recent changes to your resource packs are applied without needing to restart the game. - Profiler Graph: For a more in-depth analysis of performance,
Shift + F3opens a dedicated debug screen that includes a profiler graph. This graph offers detailed insights into where the game is spending its processing time, breaking down performance by various game systems. It’s a powerful tool for advanced users looking to pinpoint specific areas of performance concern. - Frame Time Graph: Another advanced diagnostic tool is the frame time graph, accessible by pressing
Alt + F3. This graph provides a visual representation of the time taken to render each frame, allowing you to observe fluctuations in frame rendering times. It can help identify micro-stutters or inconsistent frame delivery that might not be immediately apparent from the average FPS count alone.
Common Mistakes to Avoid
While the F3 debug screen is a powerful tool, understanding its limitations and potential pitfalls is crucial for accurate diagnosis and effective use.
- F3 Impacting FPS: It’s important to be aware that the F3 debug screen itself, by rendering additional information on your display, can sometimes lead to a slight decrease in your Frames Per Second. If your sole purpose is to monitor FPS and you are experiencing performance issues, relying on the F3 screen for an extended period might give you a slightly lower reading than your actual potential FPS. For continuous FPS monitoring without this overhead, consider using external software or the permanent FPS display feature available in newer Minecraft versions, if you only need that specific metric.
- Bedrock Edition Incompatibility: A significant point of confusion for many players is the availability of the F3 debug screen. The comprehensive F3 debug screen, as described, is a feature exclusive to Minecraft: Java Edition. It is not available to the average player in Minecraft: Bedrock Edition, which has a different codebase and debugging interface. Attempting to use F3 in Bedrock Edition will not yield the same results.
- Assuming Full Information Always Displayed: In Minecraft 1.21.9 and subsequent versions, the default F3 screen has undergone changes. It now displays a more streamlined set of information by default, showing less data than in previous iterations. If you are accustomed to seeing a wide array of statistics like targeted blocks, biome information, or the current day count, you might find these missing. To re-enable and customize the display of desired statistics, you must use the key combination
F3 + F6(or sometimesF3 + F5) to access the debug options and select what information you wish to see. - Not Using the Fn Key on Laptops: A frequent oversight for laptop users is neglecting the
Fn(function) key. On many laptop keyboards, the F-keys (F1-F12) are assigned secondary multimedia or system control functions by default. Consequently, simply pressingF3will often trigger these secondary functions (e.g., adjusting volume or screen brightness) instead of activating the Minecraft debug screen. It is usually necessary to hold down theFnkey in conjunction withF3(e.g.,Fn + F3) to access the debug screen. - Misinterpreting Data Without Context: The F3 screen presents a considerable amount of raw data, which can be overwhelming for new users. A common mistake is to look at the numbers without fully understanding what each metric represents or its typical range. For example, seeing a high memory usage might be normal for a heavily modded game, but it could indicate an issue in a vanilla setup. To effectively diagnose performance issues, it is vital to learn what each metric signifies and how to interpret it within the context of your specific game setup and hardware. Without this understanding, the data can be misleading or lead to incorrect conclusions about your game’s performance.
Tags:
YOU MAY ALSO LIKE...